Plotting charts in excel with python

By Softexperia.com 3 years ago
Home  /  Άρθρα  /  Plotting charts in excel with python
automation_of_excel_with_python

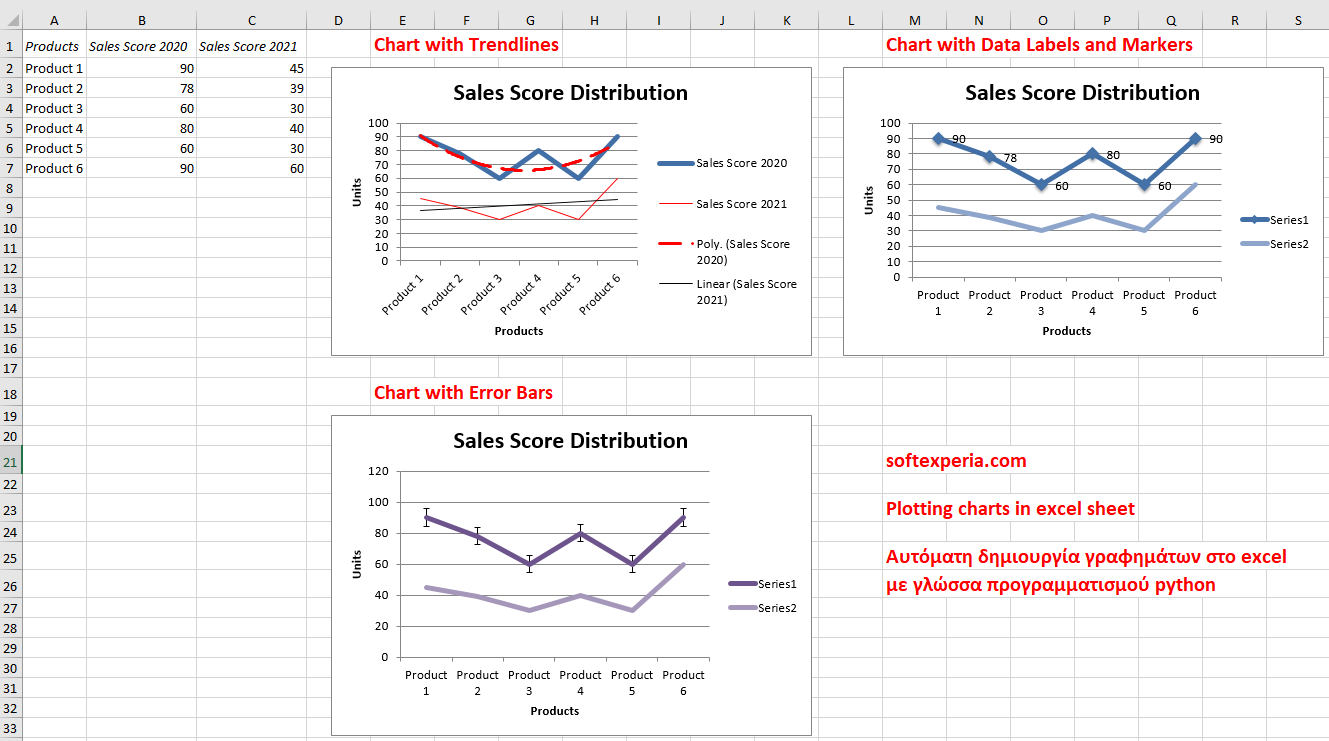
Μπορούμε να αναλύσουμε και να μετατρέψουμε σε γραφήματα, οποιοδήποτε πίνακα δεδομένων. Το μόνο που πρέπει να κάνετε εσείς, είναι να τρέξετε το πρόγραμμα που θα σας δώσουμε και το αρχείο θα δημιουργηθεί στον προκαθορισμένο φάκελο.


plotting_charts_in_excel_with_python

Products 1 to 6

Comparison of Sales (Units) for year 2020 and 2021

Products, Sales Score 2020, Sales Score 2021

Product 1, 90, 45

Product 2, 78, 39

Product 3, 60, 30

Product 4, 80, 40

Product 5, 60, 30

Product 6, 90, 60


FB Tags :

#softexperia #analysis #graphs #python / fb : Softexperia.com

Categories:
  Άρθρα, Εφαρμογές, Υπηρεσίες
this post was shared 0 times
 000

Compare

Συνεχίζοντας να χρησιμοποιείτε την ιστοσελίδα, συμφωνείτε με τη χρήση των cookies. Περισσότερες πληροφορίες.

The cookie settings on this website are set to "allow cookies" to give you the best browsing experience possible. If you continue to use this website without changing your cookie settings or you click "Accept" below then you are consenting to this.

Close